“When you change the way you look at things, the things you look at change.” https://www.linkedin.com/posts/antlerboy_when-you-change-the-way-you-look-at-things-activity-7391039947396243456-c–e How will the new size of unitary councils change the way local policy is made and delivered?
“When you change the way you look at things, the things you look at change.”
How will the new size of unitary councils change the way local policy is made and delivered?
Surrey used to have one of the lowest percentages of young people not in employment, education, or training. If I remember, it was particularly low in the regional ‘league table’ – and Lambeth was near the top. Therefore it was not a top priority.
But, as Garath Symonds pointed out to me, Surrey – being much bigger – actually had a lot *more* young people classified as ‘NEETs’.
We have the first results out from the Ministerial Sorting Hat and Surrey is to be split into two – from one county and eleven boroughs and districts. Nobody’s passionate about this result, nobody’s been arguing for this for years – but it will bring massive changes.
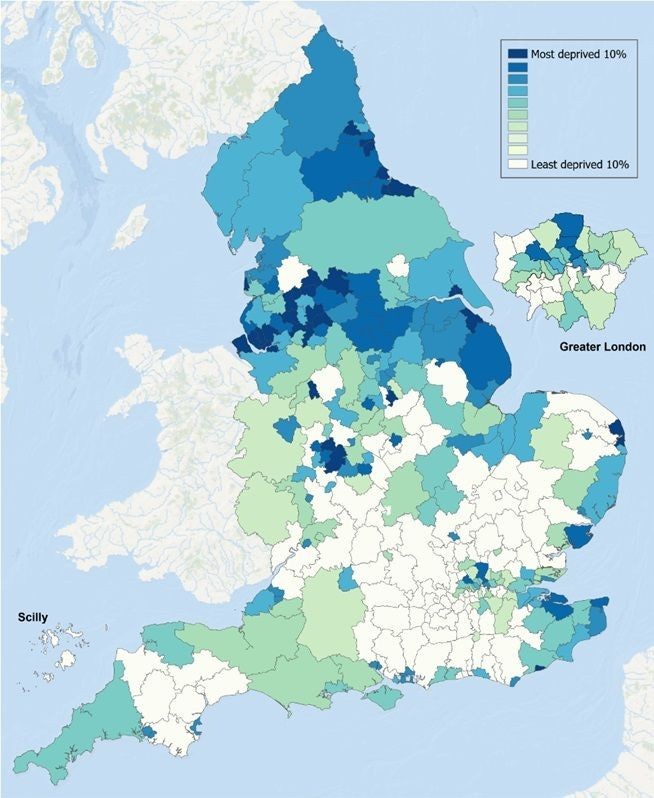
I was reminded of this when I saw that the new Indices of Multiple Deprivation, mapping relative deprivation across multiple factors across the country. Ben Murray shared a thoughtful short post reflecting on the national picture and how it reflects on St Helens Council, where he’s policy lead. He shared a map by council (the second map in this post, if I’ve got it right) – which strongly evidences the north-south divide in England.
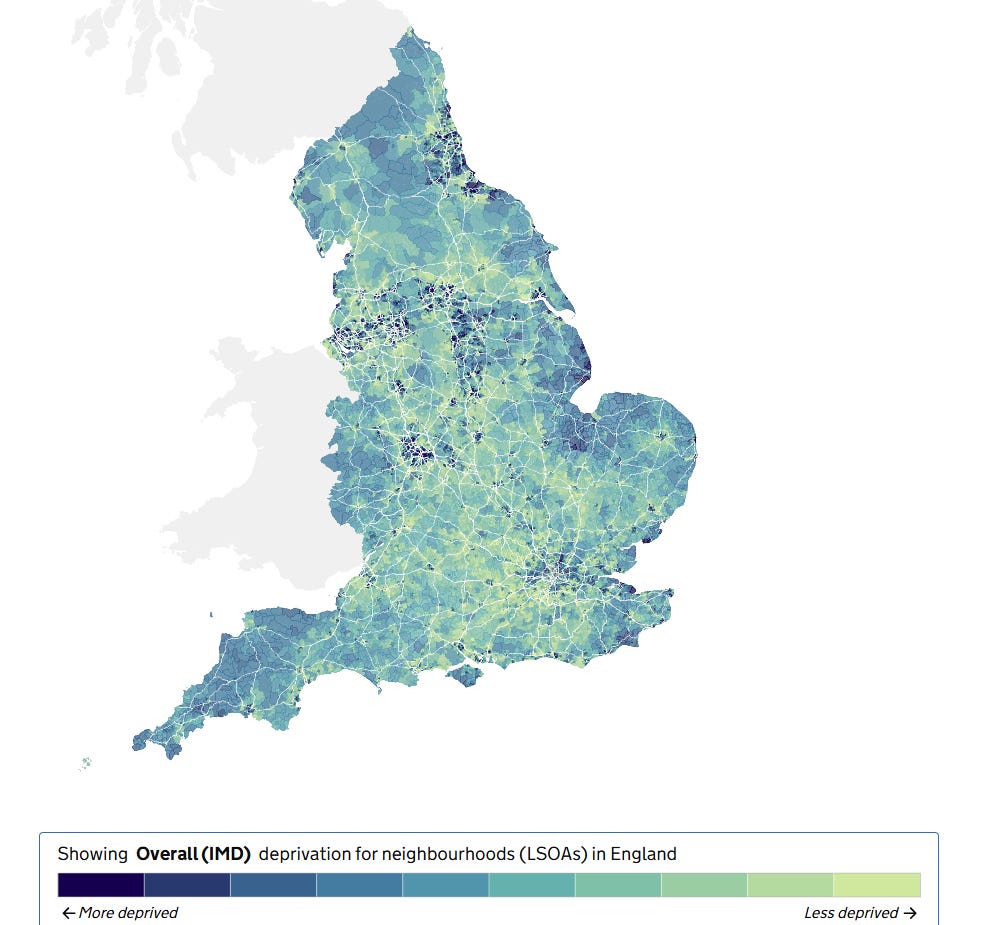
I’ve attached another map – by ‘lower super-output areas’ – smaller, consistently-sized groups of people.
It looks very different – the north-south divide (which is real) fades out slightly, and we see coastal deprivation, the southwest and the Welsh borders, dark pockets of intense deprivation cheek-by-jowl with urban wealth.
There are different challenges, of course, with intense regional issues, with rural deprivation, with highly deprived neighbourhoods in well-off cities.
Here are three reflections for those trying to make a difference:
1- Scale matters – bigger administrative units are efficient in some ways – but what are they not seeing?
2- Granularity still counts – the LSOA maps underline that using high resolution data changes what we see, and hence what we choose to act on.
3- Emergence over one-size-fits-all – policy shaped for an ‘average’ within a large unit risks missing out stratified realities. Local strategy must allow for emergent pockets of need, rapid pivot, and conversation across scales.
Surrey (as was) remedied the issue, such as it was – but the tendency is to see from the scale you’re at. The data shows what we choose to look for, and the maps we use shape the stories we tell.
The big picture is important, but we live in the details.
The challenge for the next phase of local government reform is to ensure that, when we change the way we look at things, we don’t just see something new – we act differently too.
What is shifting in your context? What surprises when you zoom in?
Here’s Ben’s post which showed me the big picture:
https://www.linkedin.com/posts/ben-murray-5b98b9bb_inequality-activity-7390063971237769217-qVE1
And here are links, where you can (very pleasingly) do your own playing with the new IMD data to see what you can see
The quote, by the way, is usually attributed to Max Planck, though there’s no conclusive evidence he said it – these days, it’s more used for a bit of gnomic wisdom in self-help woo 😊
