
(rewiring for local relationality 3/3)
Introduction
Join the debate on linkedin at
https://www.linkedin.com/posts/antlerboy_relationalpublicservices-publicservices-systemschange-share-7493586434503929856-ITxo/?utm_source=share&utm_medium=member_desktop&rcm=ACoAAACuq-oBecVFDW6PCf3lkoG-peMeuLBeoho
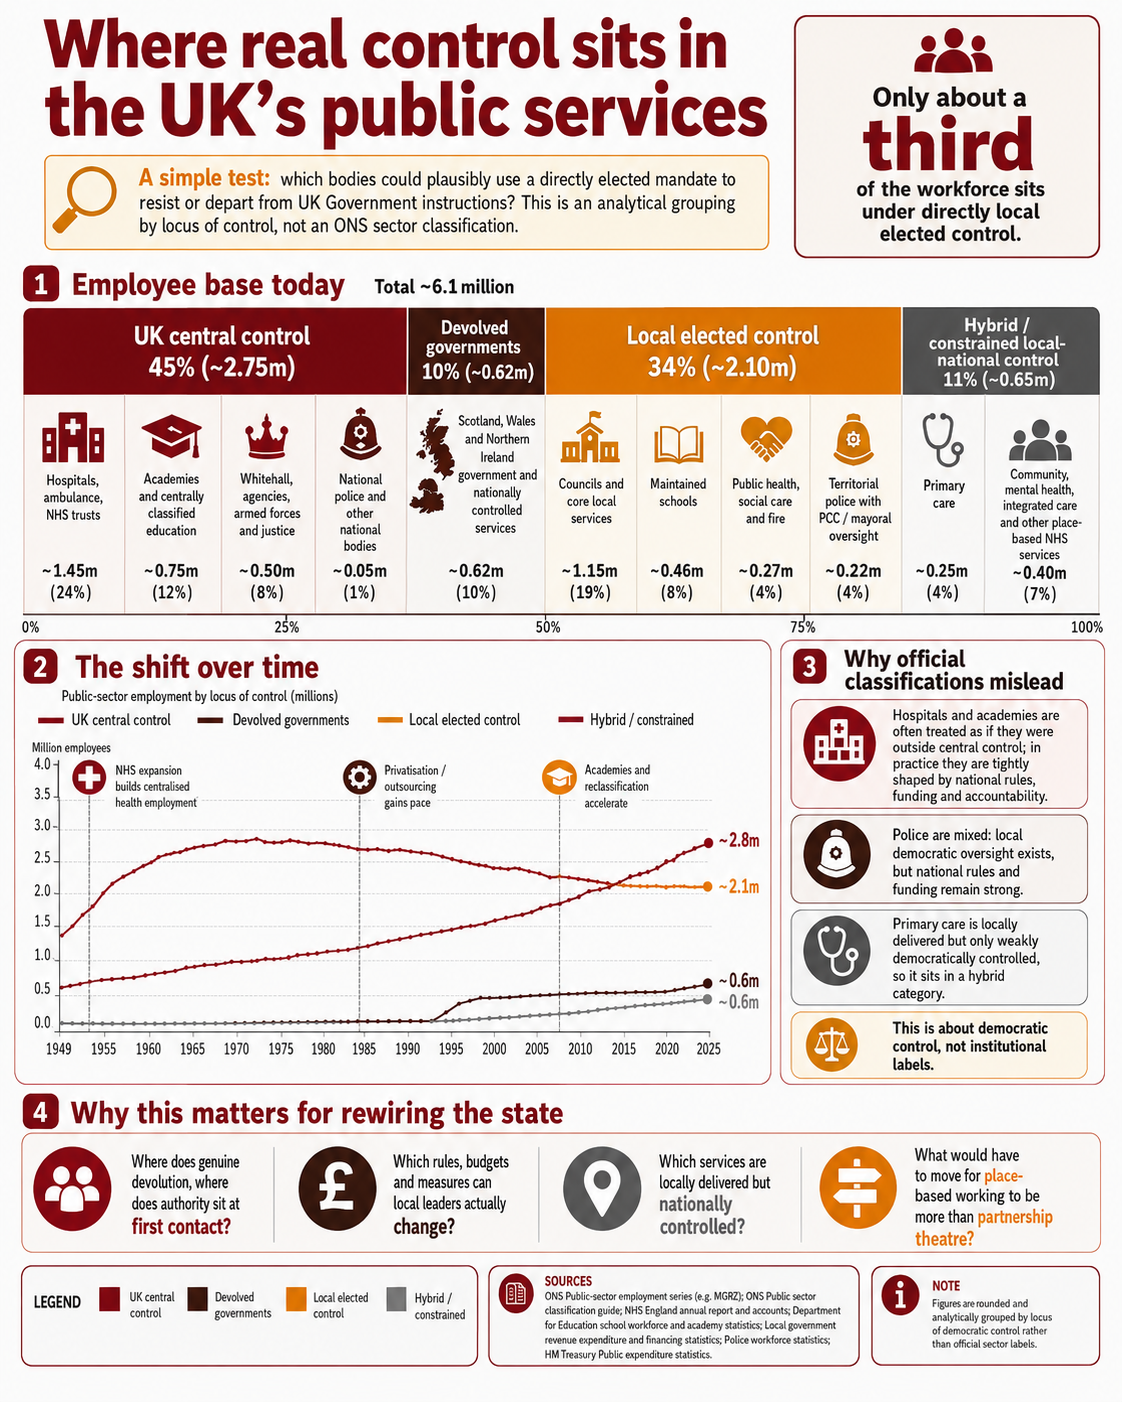
Do you know where real control sits in the UK’s public services?
I was at a fantastic event for people involved in governance of public services – smart, well-informed, dynamic, the people who make a real difference and who keep public services safe, financially viable, and well-led.
I was surprised to find that they didn’t know how many more people have been employed in central government – and how many fewer in local government – since the two great calamities of ‘austerity’ and “Brexit”.
I’ve shared this week two posts on rewiring the state for relational place-based public services – links in comments. I think it’s important to share the overall picture, and the way I’ve put it together – of course, this is broad categorisation, and very debatable!
#relationalpublicservices #publicservices #systemschange
Do you recognise this picture?
Methodology, data and limitations for the August 2026 chart set
RedQuadrant • August 2026
| Use the charts for the question they answer The chart’s I’ve shared are an analytical grouping by locus of ultimate political control. The historical chart is an ONS institutional classification. They are deliberately different. Neither measures every form of control. |
1. Purpose
The chart set was built to challenge a common ambiguity in public-service reform. A service can be delivered locally while its budget, legal form, performance regime, employment framework or intervention rights remain substantially national. ‘Local delivery’ is therefore not a sufficient test of devolution.
The analytical question is: which bodies can plausibly exercise a directly elected mandate to depart materially from UK Government policy or direction?
This identifies ultimate political control. It does not claim that operational discretion, professional power, regulatory control and financial control all sit at the same level.
2. March 2026 analytical grouping
| Category | Share | Approx. headcount | Working rule |
| UK central control | 45% | ≈2.79m | Ultimate constitutional, ministerial or funding control sits primarily with UK Government. Includes England NHS trusts, academies, Whitehall and UK agencies, armed forces and national justice bodies. |
| Devolved governments | 10% | ≈0.62m | Scottish, Welsh and Northern Irish governments and public services controlled at those national levels. |
| Local elected control | 34% | ≈2.10m | Bodies with a clear local electoral mandate and material capacity to depart from central preference: councils and core local services, maintained schools, fire/public health, and territorial policing with elected oversight. |
| Hybrid / constrained | 11% | ≈0.68m | Locally delivered services where democratic control is weak or indirect and national contracts, funding, regulation or professional frameworks remain strong. Primary care is the clearest example. |
The shares are rounded analytical estimates applied to the ONS March 2026 public-sector headcount of about 6.19 million. They should not be read as an official statistical series. The purpose is to make the control hypothesis explicit enough to challenge and improve.
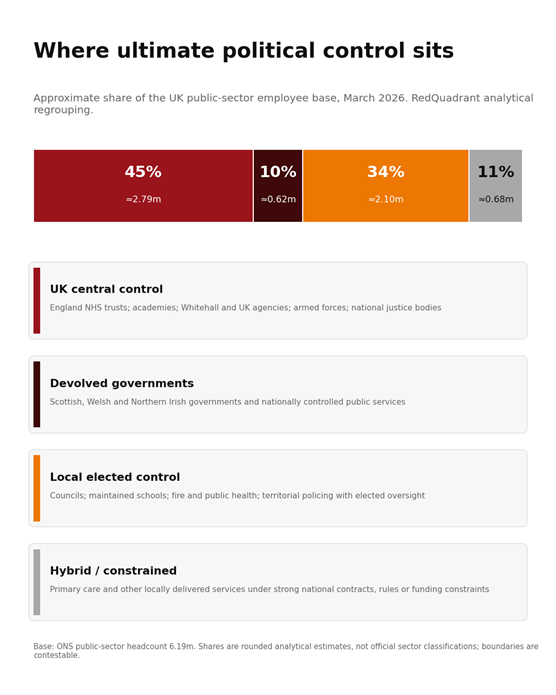
Public-facing version of the analytical grouping.
3. What the grouping does not mean
- It does not mean that everyone in a ‘central’ body is directed day-to-day from Whitehall.
- It does not mean that locally elected institutions are free of statute, grant conditions, regulation or national standards.
- It does not mean that devolved governments are independent of UK fiscal and constitutional constraints.
- It does not treat professional autonomy as the same thing as democratic control.
- It does not settle borderline institutions. Where the mandate and control rights are mixed, the chart deliberately uses a hybrid category rather than forcing a false binary.
4. Official ONS classification over time
The historical chart answers a different question: how ONS classifies public-sector employment institutionally as central government, local government or public corporations. It is useful because the official classification itself has shifted dramatically, but it cannot be read as a direct history of democratic control.
| Year | Central govt (000s) | Local govt (000s) | Public corp. (000s) | Central % | Local % | Public corp. % |
| 1999 | 2315 | 2747 | 350 | 42.8% | 50.8% | 6.5% |
| 2010 | 2829 | 2920 | 677 | 44.0% | 45.4% | 10.5% |
| Mar 2026 | 4070 | 1964 | 159 | 65.7% | 31.7% | 2.6% |
The long-run comparison is affected by institutional reform and reclassification. Academisation is particularly important. Health, education and public corporations have also changed boundaries and classifications. The chart should therefore be used to show the direction and scale of institutional change, not as a causal account of centralisation.
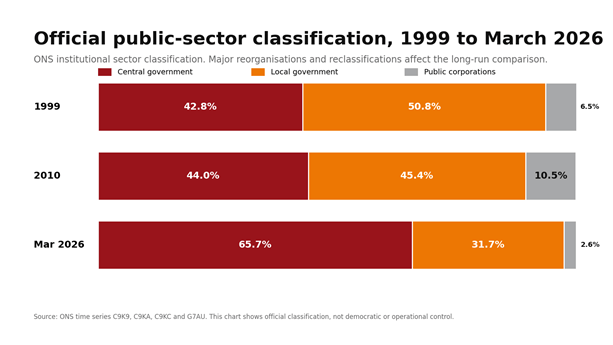
ONS institutional classification at three benchmark dates.
5. Control functions to test in any reform
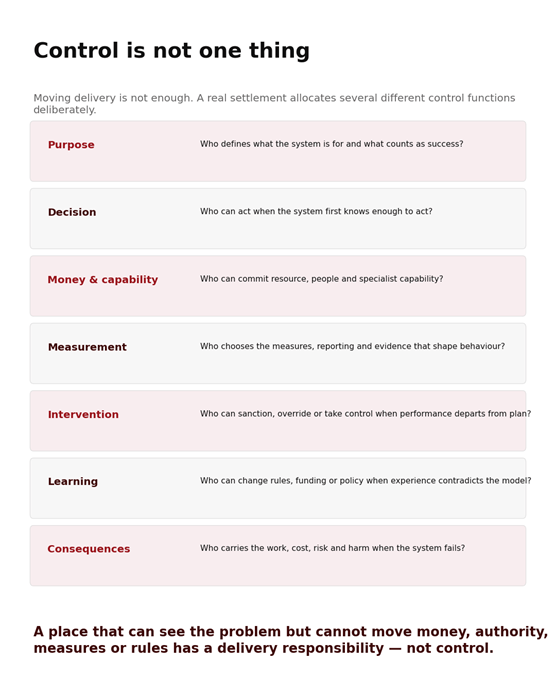
The employee-base chart is only a first cut. For an actual devolution or place-based settlement, map the control functions separately:
- Purpose — who defines success?
- Decision — who can act?
- Money and capability — who can commit resource?
- Measurement — who decides what counts and what must be reported?
- Intervention — who can override or sanction?
- Learning — who can alter rules when experience contradicts the model?
- Consequences — who carries the work, cost, risk and harm?
Sources and notes
- Public sector employment, UK: March 2026 — ONS; total public-sector employment about 6.19m; central government about 4.07m; local government about 1.964m; public corporations about 159,000 source
- ONS public-sector employment time series — Series used for benchmark chart: C9K9, C9KA, C9KC and G7AU
- Public Expenditure Statistical Analyses 2026 — HM Treasury; context for any future expenditure model
- Local authority revenue expenditure and financing: 2026–27 budget — England; context for any future expenditure model
 chosen path
SUPERBERER!!!
LikeLiked by 1 person
Benjamin, I found this illuminating.
What interests me most is not any single statistic, but seeing facts that many of us have encountered separately assembled into one picture. Putting them together in this way makes something visible that is much harder to see when each area is considered on its own.
The historical employment figures stood out to me. Your caveat demonstrates that we cannot simply read the ONS series as a transfer of democratic control. Even so, the scale is mind-boggling: employment classified as local government falls from 2.92m in 2010 to 1.964m in March 2026 — roughly a third — over a period in which the demands facing local public services have hardly become simpler.
And I wonder whether there is another consequence buried inside that change.
This picture suggests that when local government has to keep reducing capacity, understandably it protects the people required to keep statutory and frontline services functioning. What can become harder to protect is the capacity to stand above individual services and understand the whole: people who can investigate across organisational boundaries, join up evidence, redesign systems and then stay around long enough to see whether the change actually worked. Technology will undoubtedly do a significant amount of the heavy lifting, but in complex areas it cannot replace human judgement.
There is a difference between having enough capacity to ‘deliver change’ and retaining enough capacity to ‘own change’.
I found these two questions particularly interesting:
1. Measurement — who decides what counts and what must be reported?
Because control over measurement is itself a form of control. A local organisation may have considerable freedom over how it operates, but if someone else determines what success looks like and what must be reported, that freedom has boundaries. Measures direct attention, management time and resources. And what matters locally but falls outside the reporting framework can become harder to see, harder to prioritise and harder to act on.
And then:
2. Learning — what are you allowed to change once you have noticed something?
A local service can discover something that is not working. It can collect the evidence, understand the causes and perhaps even identify a better approach. But if it cannot change the funding rules, or reporting requirements, then it has learned without acquiring the power to act on that learning.
A really thought-provoking piece. Thank you for bringing the pieces together.
LikeLiked by 1 person
indeed!!!
LikeLiked by 1 person